Science & TechnologyS


Brain

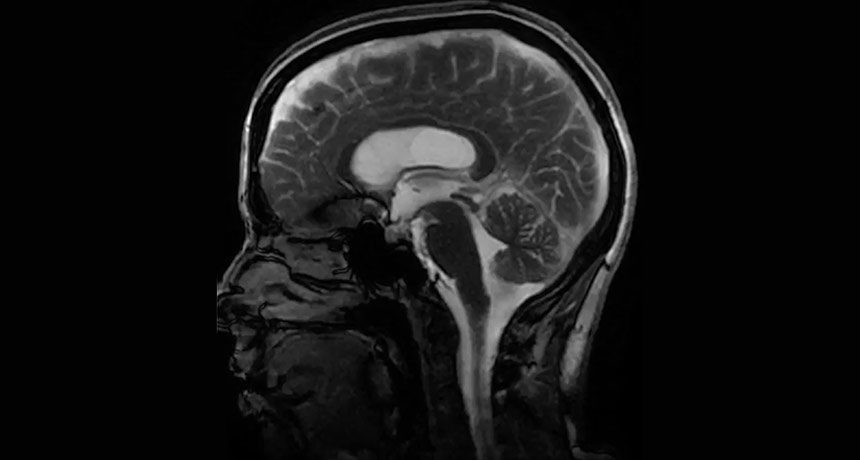
The brain wiggles and jiggles with every heartbeat

brain scan
© Stanford University and University of AucklandBy amplifying tiny movements, a new technique reveals how the brain wiggles as fluid moves in and out.
With every heartbeat, fluid squishes through the brain and jiggles it like a bowl full of jelly.

A new twist on magnetic resonance imaging illuminates these pulsing brain ripples, movements so subtle that they had escaped detection by current imaging technology. Abnormal brain motion could signal trouble, such as aneurysms or damage from a concussion.

In the new work, scientists honed an existing method called amplified MRI, a technique that stitches together multiple images taken at precise times of the heartbeat. Using an algorithm that exaggerates tiny movements, researchers at Stanford University, Stevens Institute of Technology in Hoboken, N.J., and the University of Auckland in New Zealand created a movie of the brain's rhythmic writhing as blood and cerebrospinal fluid pump in and drain out.

Doberman

World's tiniest dog has been cloned 49 times

Millie the tiny dog
The smallest dog on the planet has been cloned a record-breaking 49 times - making her a two-time world record holder.

Scientists have created 49 genetically-identical dogs based on genes from the tiny Chihuahua, known as 'Miracle Milly'.

The six-year-old pup was replicated by scientists hoping to unearth the genetic code behind her tiny stature.

'Miracle Milly' purportedly weighed less than an ounce at birth, and could curl up inside the head of a teaspoon, leading vets to speculate she would not survive.

However, the tiny dog has gone on to thrive, thanks to loving mum Vanesa Semler, 38, of Kissimmee, Florida, who fed the puppy every two hours using an eyedropper.

Since 2012, Miracle Milly was awarded the Guinness World Record for Smallest Living Dog, standing at less than 10cm (3.8in) tall and weighing just over a pound - the same as a large apple.

Arrow Down

Far from settled': New analysis shows 'Godfather' of global warming was wrong

Economist Ross McKitrick
The dire climate prediction made by former NASA scientist James Hansen "significantly overstates the warming" observed in the real world since the 1980s, according to an analysis.

Economist Ross McKitrick and climate scientist John Christy found observed warming trends match the low-end of what Hansen told Congress during a hearing on global warming organized by then-Congressman Al Gore.

"Climate modelers will object that this explanation doesn't fit the theories about climate change," the two wrote. "But those were the theories Hansen used, and they don't fit the data. The bottom line is, climate science as encoded in the models is far from settled."

Comment: The original article published by McKitrick and Christy:
The Hansen forecasts 30 years later

by Ross McKitrick and John Christy
July 3, 2018

Note: this is a revised version to correct the statement about CFCs and methane in Scenario B.

How accurate were James Hansen's 1988 testimony and subsequent JGR article forecasts of global warming? According to a laudatory article by AP's Seth Borenstein, they "pretty much" came true, with other scientists claiming their accuracy was "astounding" and "incredible." Pat Michaels and Ryan Maue in the Wall Street Journal, and Calvin Beisner in the Daily Caller, disputed this.

Hansen global warming projection
Hansen's flawed projection of global warming trends
There are two problems with the debate as it has played out. First using 2017 as the comparison date is misleading because of mismatches between observed and assumed El Nino and volcanic events that artificially pinched the observations and scenarios together at the end of the sample. What really matters is the trend over the forecast interval, and this is where the problems become visible. Second, applying a post-hoc bias correction to the forcing ignores the fact that converting GHG increases into forcing is an essential part of the modeling. If a correction were needed for the CO2 concentration forecast that would be fair, but this aspect of the forecast turned out to be quite close to observations.

Let's go through it all carefully, beginning with the CO2 forecasts. Hansen didn't graph his CO2 concentration projections, but he described the algorithm behind them in his Appendix B. He followed observed CO2 levels from 1958 to 1981 and extrapolated from there. That means his forecast interval begins in 1982, not 1988, although he included observed stratospheric aerosols up to 1985.

From his extrapolation formulas we can compute that his projected 2017 CO2 concentrations were: Scenario A 410 ppm; Scenario B 403 ppm; and Scenario C 368 ppm. (The latter value is confirmed in the text of Appendix B). The Mauna Loa record for 2017 was 407 ppm, halfway between Scenarios A and B.

Note that Scenarios A and B also differ in their inclusion of non-CO2 forcing as well. Scenario A contains all non-CO2 trace gas effects and Scenario B contains only CFCs and methane, both of which were overestimated. Consequently, there is no justification for a post-hoc dialling down of the CO2 gas levels; nor should we dial down the associated forcing, since that is part of the model computation. To the extent the warming trend mismatch is attributed entirely to the overestimated levels of CFC and methane, that will imply that they are very influential in the model.

Now note that Hansen did not include any effects due to El Nino events. In 2015 and 2016 there was a very strong El Nino that pushed global average temperatures up by about half a degree C, a change that is now receding as the oceans cool. Had Hansen included this El Nino spike in his scenarios, he would have overestimated 2017 temperatures by a wide margin in Scenarios A and B.

Hansen added in an Agung-strength volcanic event in Scenarios B and C in 2015, which caused the temperatures to drop well below trend, with the effect persisting into 2017. This was not a forecast, it was just an arbitrary guess, and no such volcano occurred.

Thus, to make an apples-to-apples comparison, we should remove the 2015 volcanic cooling from Scenarios B and C and add the 2015/16 El Nino warming to all three Scenarios. If we do that, there would be a large mismatch as of 2017 in both A and B.

The main forecast in Hansen's paper was a trend, not a particular temperature level. To assess his forecasts properly we need to compare his predicted trends against subsequent observations. To do this we digitized the annual data from his Figure 3. We focus on the period from 1982 to 2017 which covers the entire CO2 forecast interval.

The 1982 to 2017 warming trends in Hansen's forecasts, in degrees C per decade, were:
  • Scenario A: 0.34 +/- 0.08,
  • Scenario B: 0.29 +/- 0.06, and
  • Scenario C: 0.18 +/- 0.11.
Compared these trends against NASA's GISTEMP series (referred to as the Goddard Institute of Space Studies, or GISS, record), and the UAH/RSS mean MSU series from weather satellites for the lower troposphere.
  • GISTEMP: 0.19 +/- 0.04 C/decade
  • MSU: 0.17 +/- 0.05 C/decade.
(The confidence intervals are autocorrelation-robust using the Vogelsang-Franses method.)

So, the scenario that matches the observations most closely over the post-1980 interval is C. Hypothesis testing (using the VF method) shows that Scenarios A and B significantly over-predict the warming trend (even ignoring the El Nino and volcano effects). Emphasising the point here:
Scenario A overstates CO2 and other greenhouse gas growth and rejects against the observations; Scenario B slightly understates CO2 growth, overstates methane and CFCs and zeroes-out other greenhouse gas growth, and it too significantly overstates the warming.
The trend in Scenario C does not reject against the observed data, in fact the two are about equal. But this is the one that left out the rise of all greenhouse gases after 2000. The observed CO2 level reached 368 ppm in 1999 and continued going up thereafter to 407 ppm in 2017. The Scenario C CO2 level reached 368 ppm in 2000 but remained fixed thereafter. Yet this scenario ended up with a warming trend most like the real world.

How can this be? Here is one possibility. Suppose Hansen had offered a Scenario D, in which greenhouse gases continue to rise, but after the 1990s they have very little effect on the climate. That would play out similarly in his model to Scenario C, and it would match the data.

Climate modelers will object that this explanation doesn't fit the theories about climate change. But those were the theories Hansen used, and they don't fit the data. The bottom line is, climate science as encoded in the models is far from settled.

Ross McKitrick is a Professor of Economics at the University of Guelph.

John Christy is a Professor of Atmospheric Science at the University of Alabama in Huntsville.


Attention

Leprosy lurking in armadillos in Brazil's Amazon

armadillo
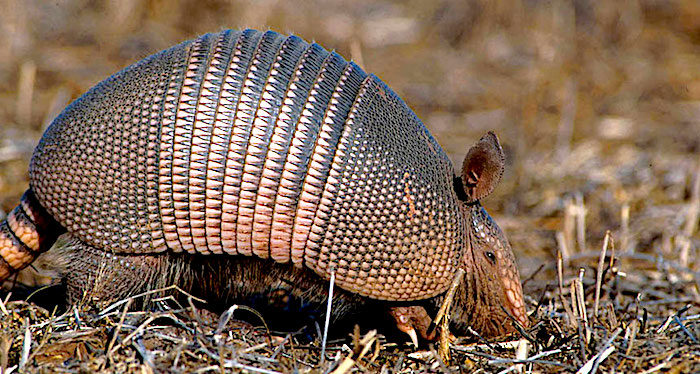
© unknownArmadillo infection: Nine-banded armadillos, such as above, may help spread leprosy to people in Brazil.
The South American country has the world's second-highest number of cases of the disease

Brazilians who hunt or eat armadillos are at a higher risk of catching leprosy than people who don't interact with the animals, a new study finds.

More than 60 percent of armadillos tested in Brazil's Amazonian state of Pará carry the leprosy bacterium Mycobacterium leprae. And about 63 percent of people tested in two villages in the region have antibodies against the bacterium, suggesting that they had been infected. People who ate armadillos more often had more of these antibodies in their blood, researchers report June 28 in PLOS Neglected Tropical Diseases.

The findings may settle a debate about whether armadillos are implicated in the spread of leprosy, also known as Hansen's disease, in Brazil. Knowing whether armadillos are involved in leprosy's spread could potentially help public health officials limit the spread of the debilitating disease, which can cause nerve damage and disfigurement.

Brazil has the second highest number of leprosy cases in the world. In 2016, 25,218 new cases of leprosy were diagnosed. Only India had more, with 135,485 new cases, according to the World Health Organization.

2 + 2 = 4

Most scientific studies are wrong - diet studies are some of the worst

science studies stack of papers
© Elnur/Shutterstock
A few years ago, two researchers took the 50 most-used ingredients in a cook book and studied how many had been linked with a cancer risk or benefit, based on a variety of studies published in scientific journals.

The result? Forty out of 50, including salt, flour, parsley and sugar. "Is everything we eat associated with cancer?" the researchers wondered in a 2013 article based on their findings.

Their investigation touched on a known but persistent problem in the research world: too few studies have large enough samples to support generalized conclusions.

But pressure on researchers, competition between journals and the media's insatiable appetite for new studies announcing revolutionary breakthroughs has meant such articles continue to be published.

"The majority of papers that get published, even in serious journals, are pretty sloppy," said John Ioannidis, professor of medicine at Stanford University, who specializes in the study of scientific studies.

This sworn enemy of bad research published a widely cited article in 2005 entitled: "Why Most Published Research Findings Are False."

Since then, he says, only limited progress has been made.

Monkey Wrench

Panama monkeys may have just stumbled into the Stone Age - footage shows tool use

white-faced capuchins stone tools
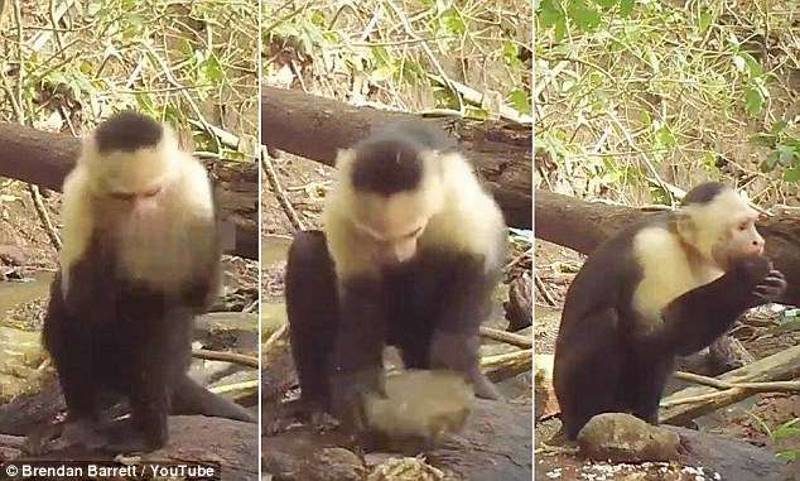
© Brendan Barrett/YouTubeFootage has revealed evidence that another non-human primate has entered its stone age. It shows white-faced capuchin use stone tools to crack the protective shells of nuts and other foods (pictured)
Another non-human primate has entered the Stone Age - the fourth type known to have done so. A population of white-faced capuchins living on a Panamanian island routinely use stones to smash open nuts and shellfish. Other nearby populations don't use stone tools, which might suggest that primates - perhaps including our ancestors - stumble into the Stone Age by chance.

Chimpanzees in West Africa, macaques in Thailand and several species of tufted capuchin monkey living in South America use stone tools to access food. Brendan Barrett at the Max Planck Institute for Ornithology in Radolfzell, Germany, and his colleagues have now discovered that a species of non-tufted, slender-bodied capuchin also uses stone tools (bioRxiv, doi.org/crn7).

Blue Planet

Russian report: Earth must protect itself from mutant space bacteria

Earth
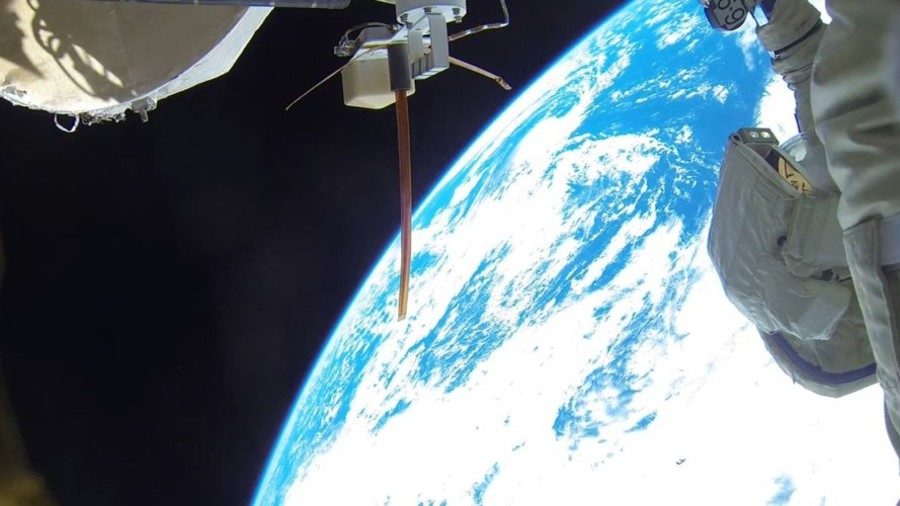
© Roskosmos press service / SputnikView of Earth from the International Space Station.
Terrestrial bacteria that were sent to space and returned changed now pose a threat to the existence of life on Earth, and measures must be taken planetside to contain them, Russian scientists said.

A Russian experiment called 'Biorisk' has revealed that various microorganisms from Earth were able to survive in the harsh conditions of space on the surface of the International Space Station (ISS). It was carried out starting in January 2005 at the Russian segment of the ISS and saw 68 different organisms, including bacteria, insects, vertebrate animal and higher plants, used as test subjects.

The mutated bacteria showed high aggressiveness and resistance to antibiotics on their return to Earth, the Russian report, prepared for the meeting of the International Committee on Space Research in the US later in July, said.

Eggs of crustaceans and caviar of African toothcarp fish also managed to survive in outer space for 2.5 years, with the embryos revived after returning to Earth, it added.

Comment: Alien life? Living bacteria 'that had not been there' found on ISS hull, Russian cosmonaut says


Bug

Spiders found to use Earth's electrical field to 'balloon' hundreds of miles

ballooning spiders
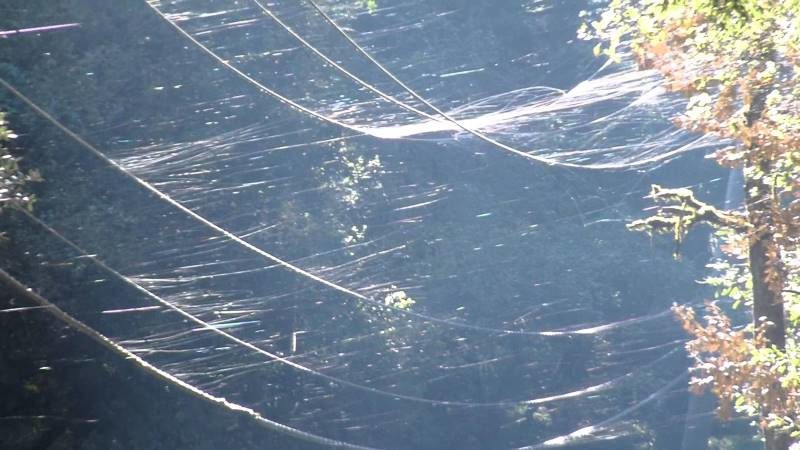
© Little Grove FarmsSpiderlings ballooning in the Santa Cruz Mountains of the San Francisco Peninsula
Scientists are finally starting to understand the centuries-old mystery of "ballooning."

But Erica Morley and Daniel Robert have an explanation. The duo, who work at the University of Bristol, has shown that spiders can sense the Earth's electric field, and use it to launch themselves into the air.

Every day, around 40,000 thunderstorms crackle around the world, collectively turning Earth's atmosphere into a giant electrical circuit. The upper reaches of the atmosphere have a positive charge, and the planet's surface has a negative one. Even on sunny days with cloudless skies, the air carries a voltage of around 100 volts for every meter above the ground. In foggy or stormy conditions, that gradient might increase to tens of thousands of volts per meter.

Cloud Grey

Are noctilucent clouds increasing because of the cooling climate, and the rise of fireball and volcanic activity?

noctilucent clouds
© NASA

Increased water vapor in Earth's atmosphere
due to human activities is making shimmering high-altitude clouds more visible, a new study finds. The results suggest these strange but increasingly common clouds seen only on summer nights are an indicator of human-caused climate change, according to the study's authors.


Noctilucent, or night-shining, clouds are the highest clouds in Earth's atmosphere. They form in the middle atmosphere, or mesosphere, roughly 80 kilometers (50 miles) above Earth's surface. The clouds form when water vapor freezes around specks of dust from incoming meteors. Watch a video about noctilucent clouds here.


Comment: As well as the ever increasing fireball activity: Michigan Meteor Event: Fireball Numbers Increased Again in 2017


Humans first observed noctilucent clouds in 1885, after the eruption of Krakatoa volcano in Indonesia spewed massive amounts of water vapor in the air. Sightings of the clouds became more common during the 20th century, and in the 1990s scientists began to wonder whether climate change was making them more visible.


Comment: Volcanic activity worldwide is on the increase, which may help explain this years dazzling NLC display.


Comment: As noted in Rare high-elevation tornado forms near Weston Pass Fire, Colorado:
Recently other climate scientists were saying hurricane Harvey "should serve as a warning", as they continue to push the man-made climate change/global warming lie. They are not considering the importance of atmospheric dust loading and the winning Electric Universe model in their research. Such information and much more, are explained in the book Earth Changes and the Human Cosmic Connection by Pierre Lescaudron and Laura Knight-Jadczyk.
The accumulation of cometary dust in the Earth's atmosphere plays an important role in the increase of tornadoes, cyclones, hurricanes and their associated rainfalls, snowfalls and lightning. To understand this mechanism we must first take into account the electric nature of hurricanes, tornadoes and cyclones, which are actually manifestations of the same electric phenomenon at different scales or levels of power.
Increasing cometaryand volcanic dust loading of the atmosphere (one indicator is the intensification of noctilucent clouds we are witnessing) is accentuating electric charge build-up, whereby we can expect to observe more extreme weather and planetary upheaval as well as awesome light shows and other related mysterious phenomena.
Also check out SOTT radio's:


Pi

Tiny version of this physics toy reveals quantum secrets

Newton's cradle spheres
© SARAWUTH792Metal spheres in a Newton’s cradle (shown) swing back and forth rhythmically. The toy has inspired a quantum experiment where atoms replace the balls.
A simple toy is helping scientists understand new details of a mysterious quantum process.

The rhythmic click-clacking of the metal balls in Newton's cradle has long entertained physics students. Now, scientists have re-created the toy on an atomic scale, using it to probe how quantum systems reach a balanced state known as thermal equilibrium.

Leave a mug of hot coffee on the counter, and it will gradually cool until it reaches thermal equilibrium, matching the temperature of the room. That process, called thermalization, is well understood on the scale of coffee cups. But at the quantum level, thermalization becomes murky.

"This is an area of physics that we fundamentally don't understand," says physicist Benjamin Lev of Stanford University, who presented the work June 26 at the Quantum Thermodynamics meeting at the Kavli Institute for Theoretical Physics at the University of California, Santa Barbara. That lack of understanding of such a basic process means that "it behooves us scientists to investigate," Lev says. So he and colleagues studied how introducing chaos into a quantum Newton's cradle paves the way for thermalization.